
The September 2025 Lee County Florida Foreclosure Report was complied by Jeff Tumbarello, Director SWFL REIA , Broker/Owner Steelbridge Realty LLC Principal , Venture Investment Partners
- This report was prepared personally and is shared with you for informational purposes.
- The data presented here has been compiled from multiple trusted sources, including the Lee County Clerk of Court.
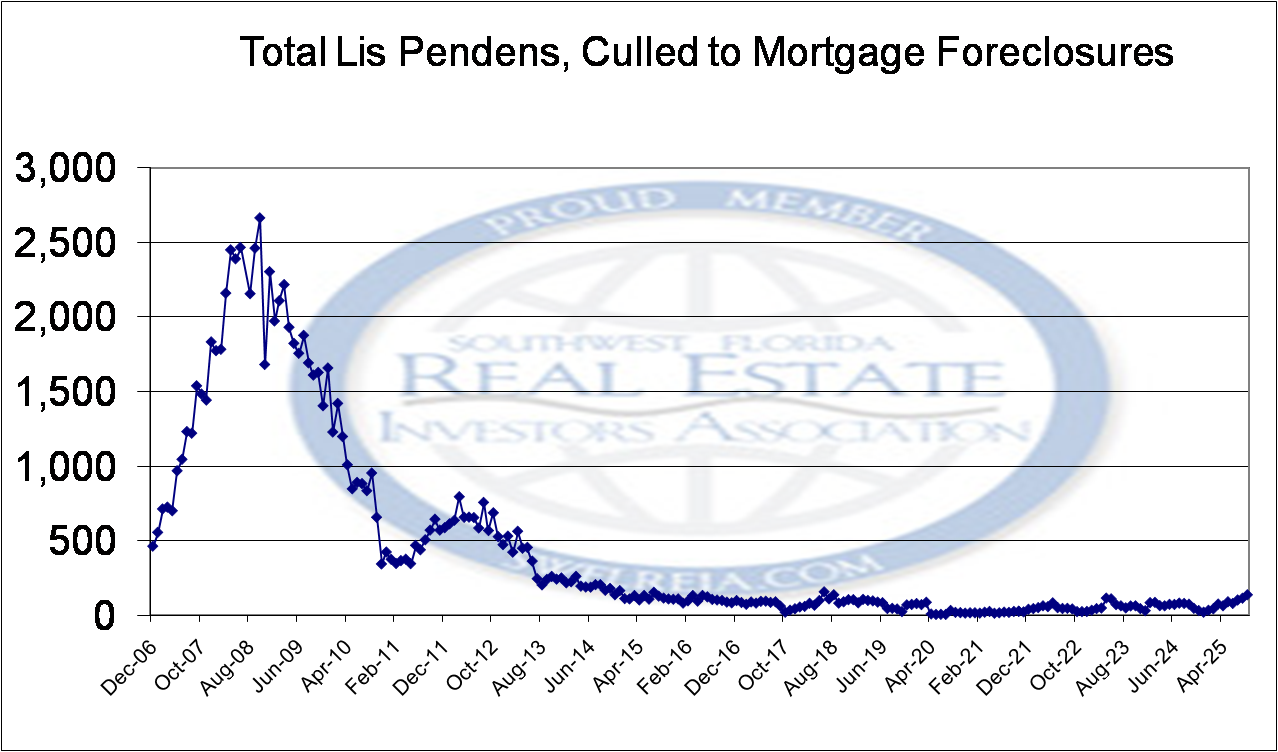
This chart provides a perspective on the September 2025 Lee County Florida Foreclosure Report, comparing data from the Global Financial Crisis to today:
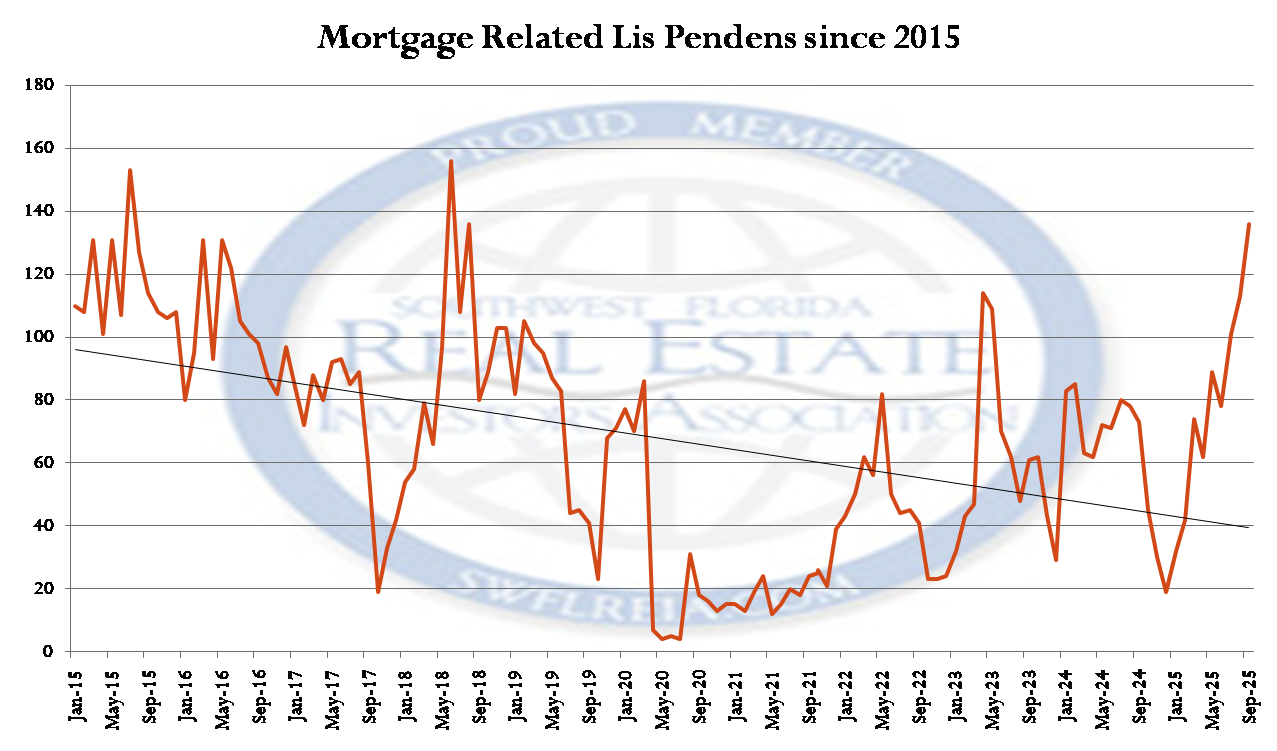
This chart displays The September 2025 Lee County Florida Foreclosure Report from 2015 onward.
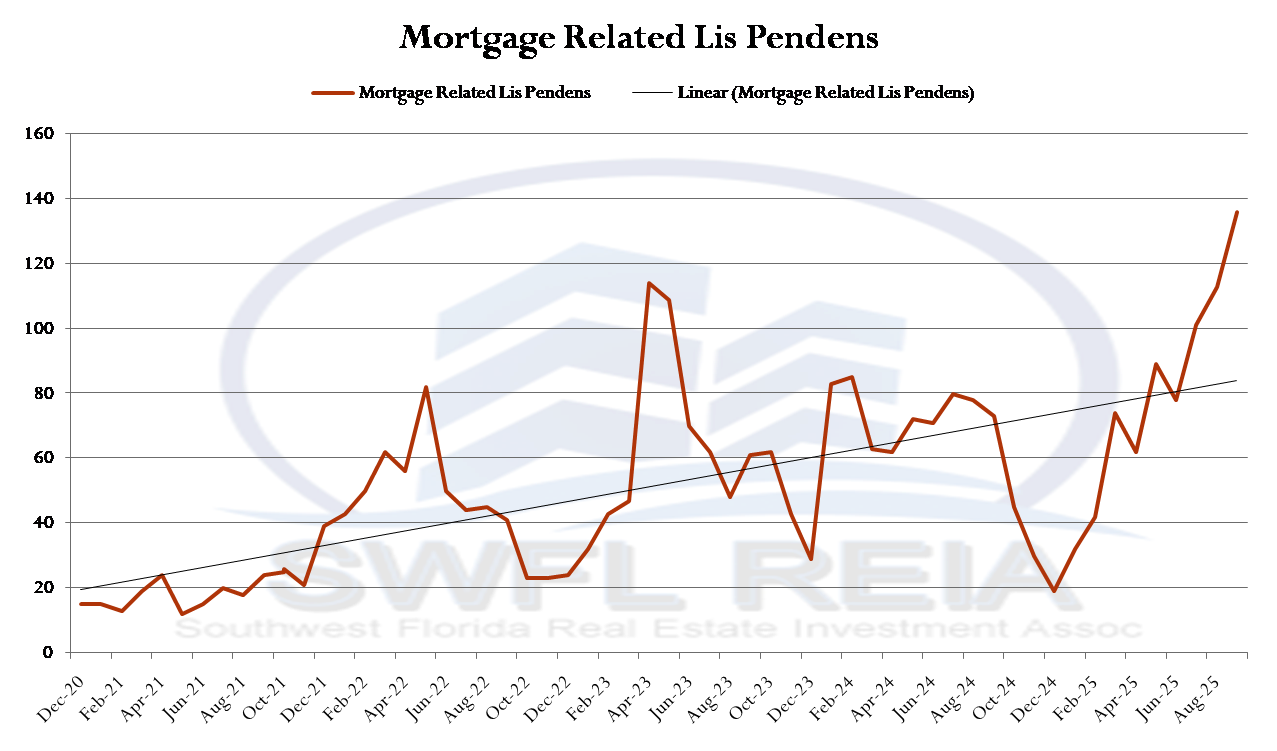
This chart displays The September 2025 Lee County Florida Foreclosure Report from 2020 onward.
2008–2010 was a shock-and-surge. 2025 looks like case-by-case distress with more equity in the system—manageable levels, not meltdown territory.

Lets Talk about the Lee County Residential Market
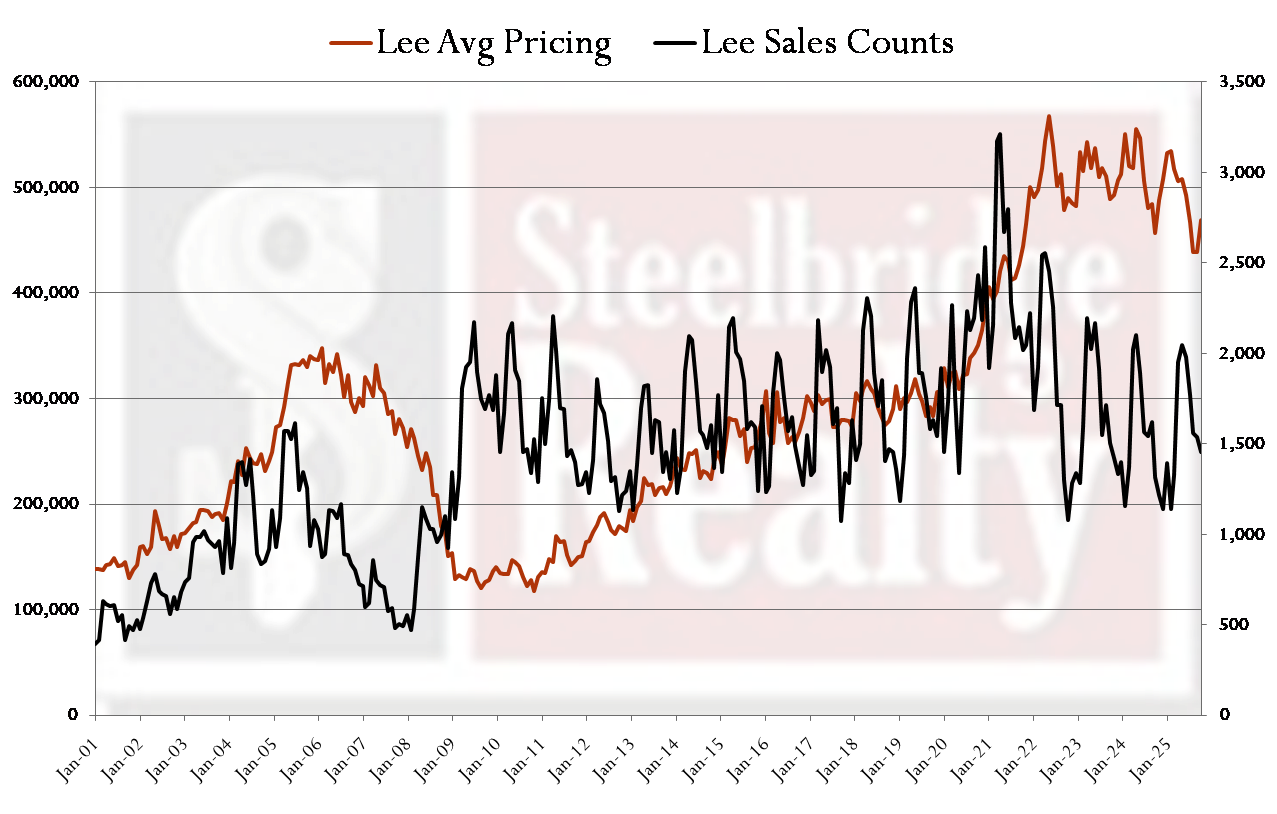
This chart shows the Lee County, Florida residential market, exported from the MLS and trended in Excel, covering data from 2001 onward. It reflects the average price for all property types classified as residential in the MLS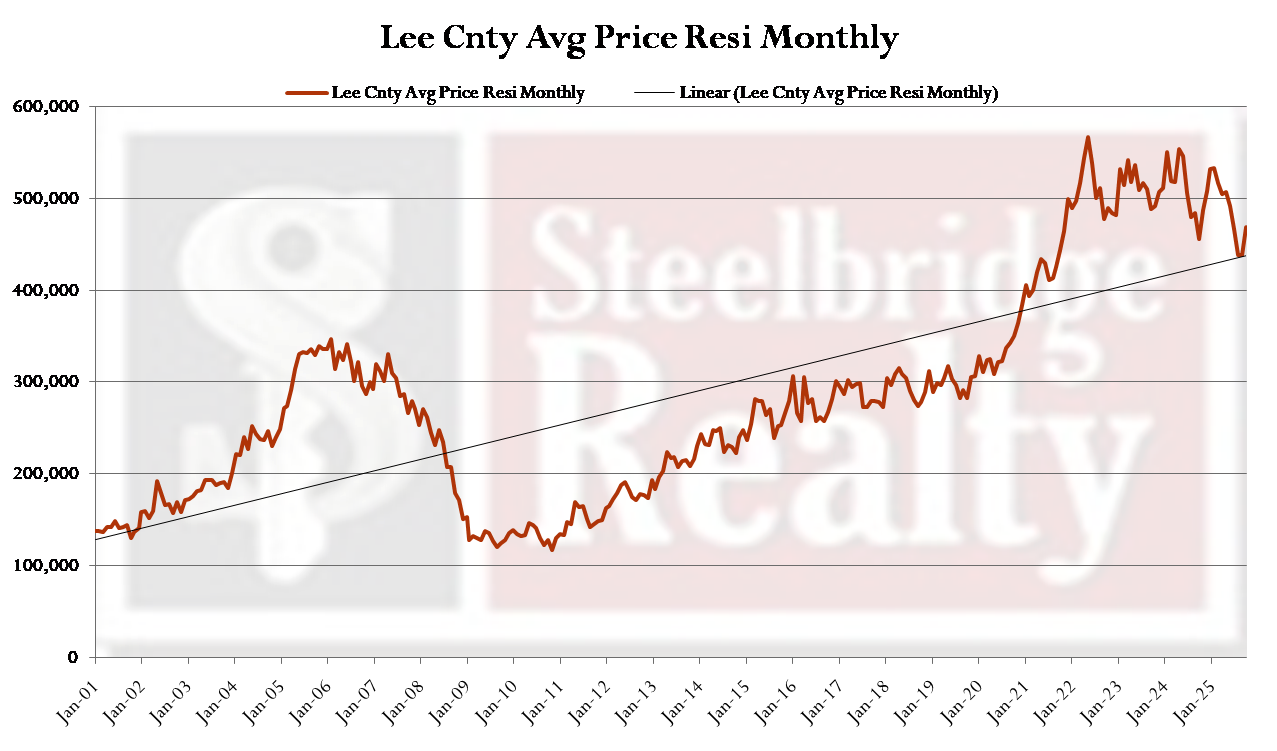
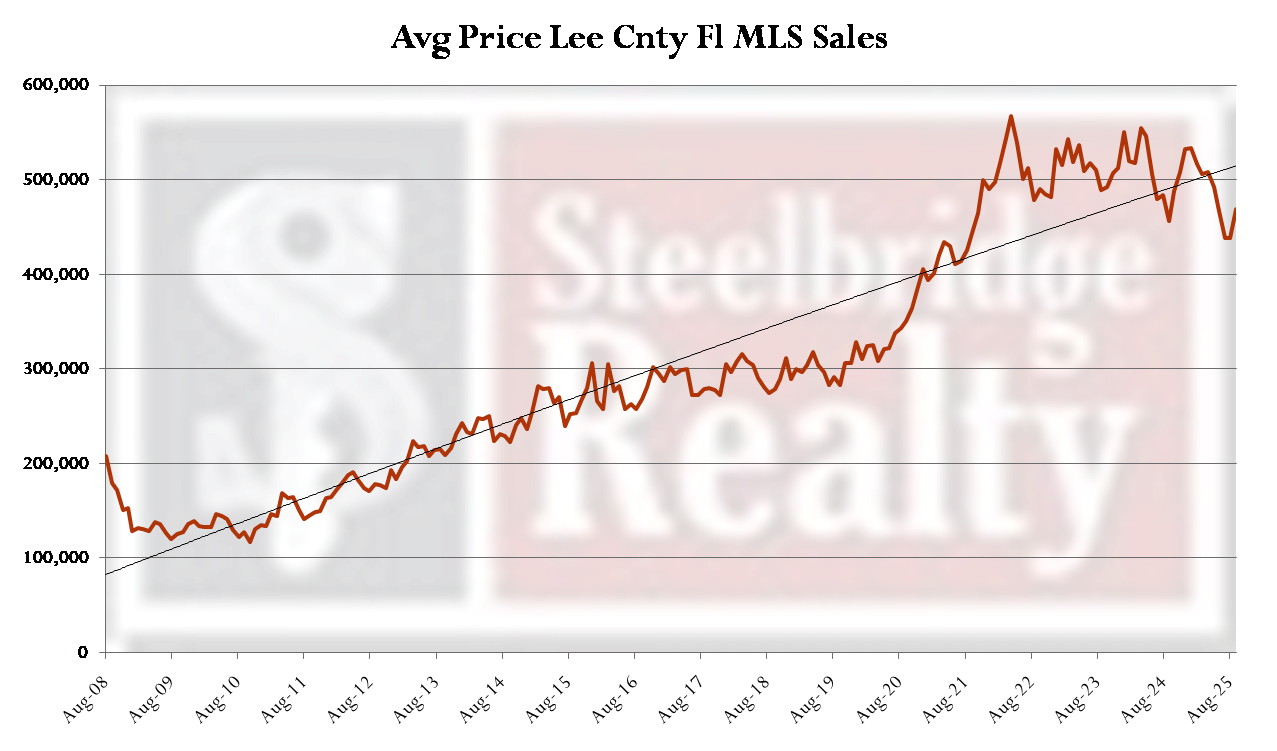
This chart shows the Lee County, Florida residential market, exported from the MLS and trended in Excel, covering data from 2008 forward. It reflects the average price for all property types classified as residential in the MLS — from the trough of the Global Financial Crisis to today.
This chart shows the Lee County, Florida residential market, exported from the MLS and trended in Excel, covering data from 2001 forward. It reflects the average price for all property types classified as residential in the MLS, and also charts — on a separate axis — the sales counts for the same period.
Closing Notes – September 2025 Lee County Foreclosure Report
- This report is done for for context—not clickbait: Today’s foreclosure activity in Lee County is only a fraction of the 2008–2010 spike. What we’re seeing now is simply a normalizing distressed market.
- For September 2025, there were 240 raw Lis Pendens filings. Of these, 136 were mortgage-related. The majority of the rest were tied to construction liens and HOA liens.
- Sales Counts have been positive or neutral 5 months of this year, from a year over year perspective.
- All of the click bait headlines say that the FHA moratoriums ended 10/1. Lets see if they are correct.
A Return to Normalcy, Not Crisis
Foreclosures are back in the conversation, but what we’re seeing looks more like a return to a “normal” distressed market than a repeat of the Global Financial Crisis.Equity Cushions the Blow
Unlike the mid-2000s, many homeowners today have built-in equity. That means more workouts, payoffs, or traditional sales before cases ever reach the auction block.Trend Worth Watching
Month-to-month bumps will happen, but the overall trajectory so far suggests adjustment—not collapse. We’ll continue to track the filings to see if this pace holds steady or accelerates.Perspective Matters
Today’s foreclosure activity may grab headlines, but context is key: levels remain far below the towering wave of the 2008–2010 crisis.
Each real estate cycle is unique in both duration and intensity, reflecting the complex interplay of economic, social, and political factors.
Typically, these cycles follow a pattern of boom, bust, and recovery:
- Duration: Real estate cycles can vary greatly in length. Some may last only a few years, while others can extend over decades. The duration often depends on underlying economic conditions, such as employment rates, interest rates, and GDP growth, as well as broader societal trends like urbanization and demographic shifts.
- Intensity: The intensity of a real estate cycle refers to the magnitude of price fluctuations and transaction volumes during the boom and bust phases. An intense boom period is characterized by rapidly increasing property values and high transaction volumes, often driven by speculative investing and easy credit. Conversely, a severe bust might see steep declines in property values and a significant drop in market activity, influenced by tighter credit conditions, economic downturns, or regulatory changes.
The differences in duration and intensity can result in significantly different outcomes from one cycle to the next. For example, a cycle influenced by a robust economic backdrop and innovative financial products might exhibit a prolonged and intense boom followed by a sharp but brief correction. In contrast, cycles dominated by cautious lending and slow economic growth may feature more moderated growth and a less severe downturn. Understanding these dynamics is crucial for investors, policymakers, and stakeholders to navigate the real estate market effectively.
Lets discuss Real Estate Corrections.
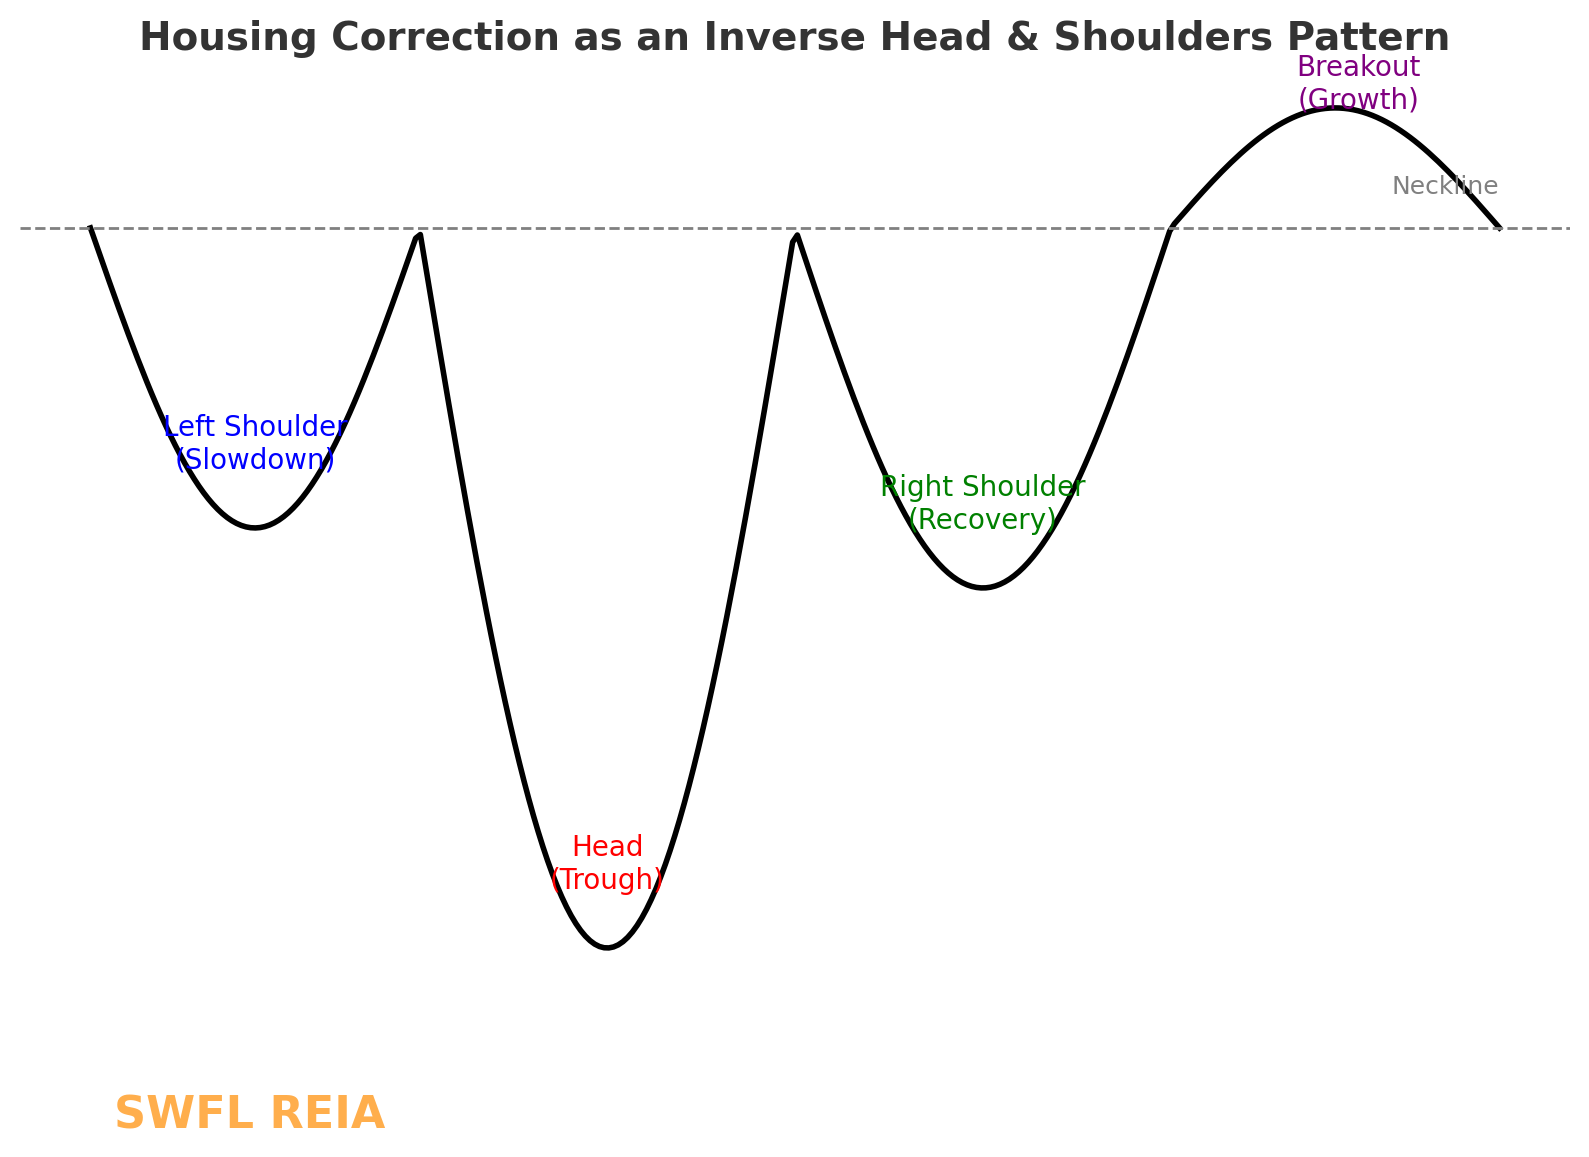
A Housing Correction Isn’t the End of the World — It’s an Inverted Head & Shoulders
When most people hear the phrase housing correction, they immediately think of doom and gloom. But in reality, a correction is often just part of a larger market cycle — and in many ways, it mirrors a classic technical analysis pattern: the inverse (upside-down) head and shoulders.
Left Shoulder – The First Dip
The market softens as affordability tightens, rates rise, or external shocks create caution. Activity slows, prices pull back modestly, and headlines turn negative. This is the first dip — painful, but not catastrophic.
Head – The Deepest Trough
This is where pessimism peaks. Inventory builds, foreclosures or distressed sales rise, and buyers pull back. In the chart, this is the “head” — the lowest point. But importantly, it sets the stage for recovery.
Right Shoulder – A Higher Low
Markets stabilize. Distress clears out, serious buyers re-emerge, and prices start to firm up. It’s not “boom time” again, but the worst is over. The key here: the low is higher than the previous trough.
Breakout – The Recovery Leg
Just like in charting, once the “neckline” is broken (confidence returns, demand outpaces supply), the market begins a sustained move upward. Historically, real estate corrections tend to lead into new periods of growth rather than permanent collapse — especially in diverse, demand-driven economies like ours.
✅ The Takeaway:
A correction doesn’t mean collapse — it’s a recalibration. If you zoom out, it looks less like an ending and more like a setup for the next leg up. Think of it as the market resetting its foundation, much like an upside-down head and shoulders pattern before a breakout.
See you at a meeting Soon!
We meet twice a month.
Click here for information about the monthly luncheon.
Click here for information about our nighttime general meeting.
One of the premier sources for real estate investing networking and education is the SWFL REIA. In the real estate world, the SWFL REIA is different in that they do not do information product sales. Our meetings focus on the best ways of investing in real estate by collaborating with other property investors who are sharing their experiences.
We look forward to meeting you at a meeting soon!
Click here for membership information
Get our meeting notices and market data emailed to you.