
The June 2025 Lee County Florida Foreclosure Report was complied by Jeff Tumbarello, Director SWFL REIA , Broker/Owner Steelbridge Realty LLC Principal , Venture Investment Partners
- This report was prepared personally and is shared with you for informational purposes.
- The data presented here has been compiled from multiple trusted sources, including the Lee County Clerk of Court.
Let’s talk about ATTOM and its foreclosure methodology—specifically how it counts each individual document (like a Lis Pendens, Notice of Sale, or REO filing) as a separate “foreclosure action.” The problem? The media often misinterprets this and reports the total as actual foreclosures, creating a distorted picture of market distress.
How ATTOM Captures Foreclosure Activity
ATTOM defines “foreclosure activity” to include any of the following three legal notices:
Notice of Default (NOD) – The first step in the foreclosure process in judicial states.
Notice of Trustee Sale (NTS) or Lis Pendens (LP) – Public notice of legal action.
Real Estate Owned (REO) – When the lender has taken possession after the auction.
Each of these steps is logged as an individual foreclosure action.
⚠️ The Problem: One Property = Multiple Foreclosure “Actions”
Let’s say a single property goes through:
A Lis Pendens filed in January
A Notice of Sale issued in March
It becomes REO in May
ATTOM would log that as 3 separate foreclosure actions—even though it’s one foreclosure case.
How This Skews the Data
Artificially inflates foreclosure counts.
Media reports “3X jump in foreclosures!” but it’s often just an increase in how many document stages were filed, not necessarily in new distressed properties.
In judicial states like Florida, this distortion is worse due to longer timelines and more docket filings.
Non-judicial states (like Texas) might only have 1 or 2 filings, so the cross-state comparison is flawed.
Why It Matters
Investors and homeowners get unnecessary spooked.
Policymakers and regulators may overreact to “data noise.”
Local markets (like SWFL) get painted with a broad brush.
It’s a real estate version of Chinese Telephone—source → ATTOM methodology → headline → panic.
✅ How to Counter It
Use primary source data directly from county clerks/public records.
De-dupe filings by property address or parcel ID to find unique foreclosures.
Track first filing dates instead of total filings for more realistic market pulse.
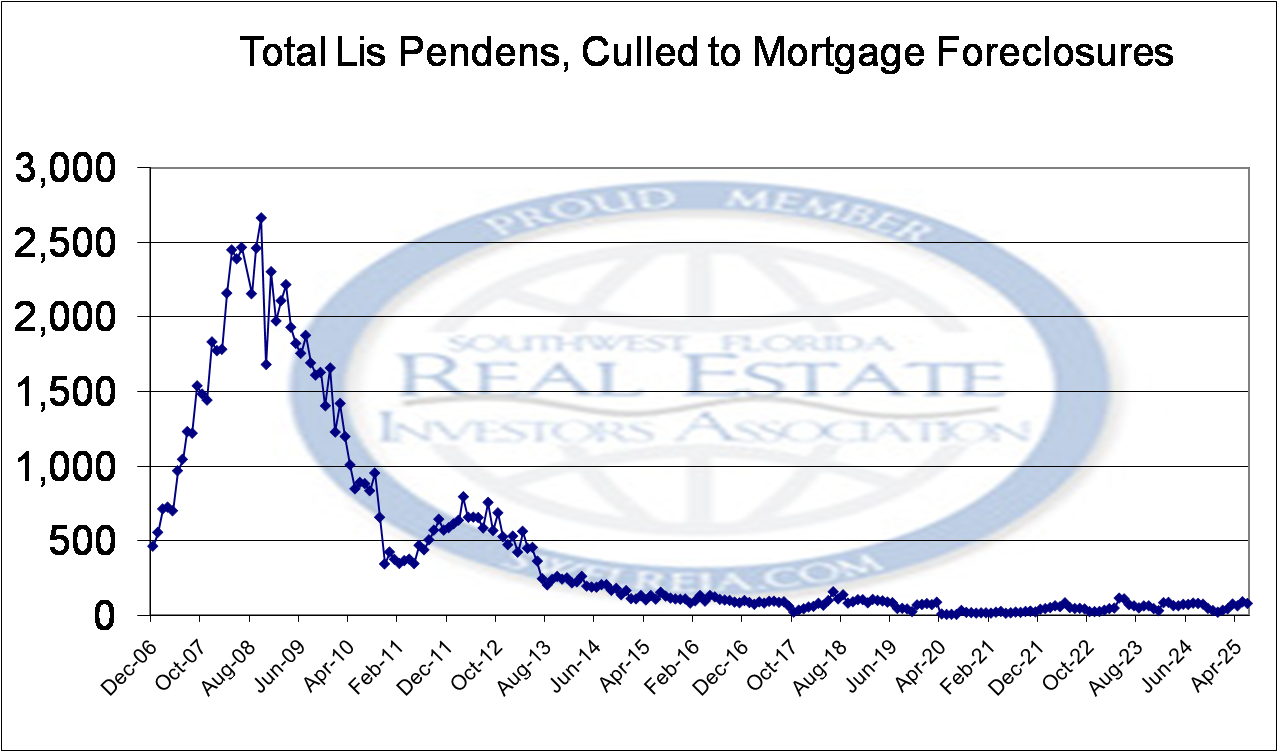
This chart provides a perspective on the The June 2025 Lee County Florida Foreclosure Report, comparing data from the last financial crisis to today:
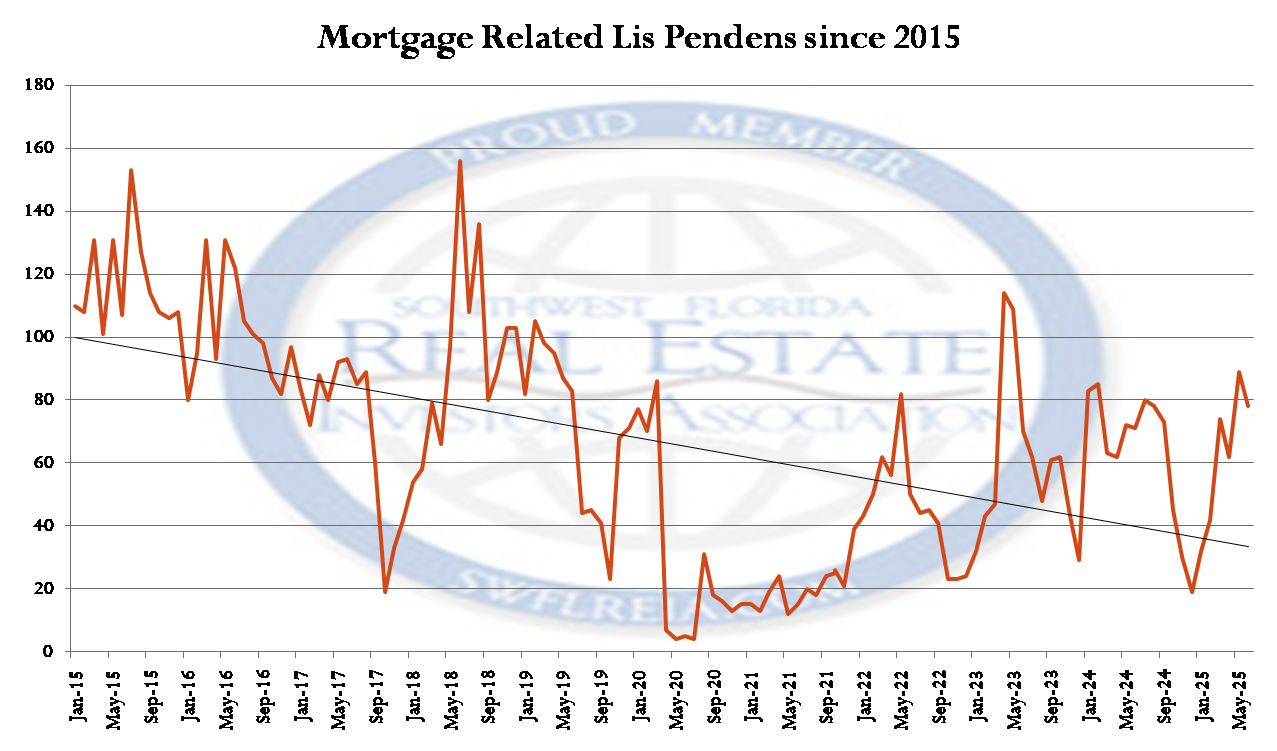
This chart displays The June 2025 Lee County Florida Foreclosure Report from 2015 onward.
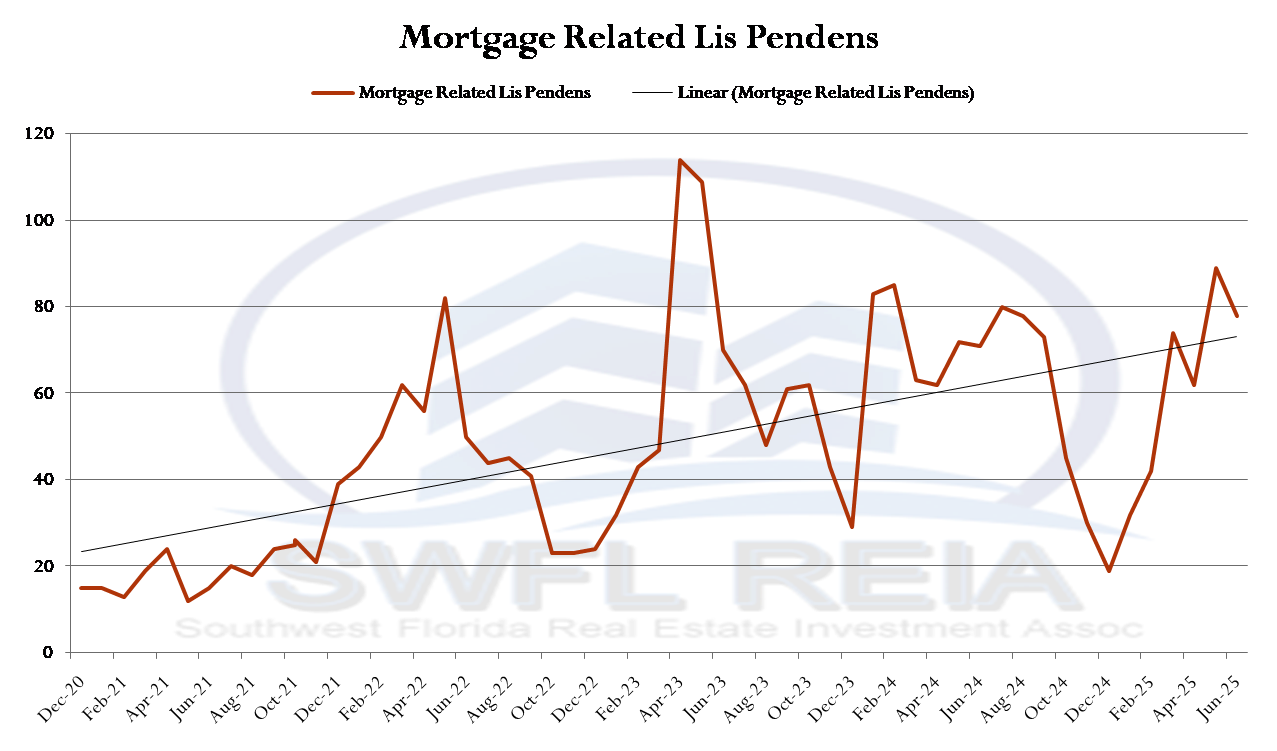
This chart displays The June 2025 Lee County Florida Foreclosure Report from 2020 onward.
Each real estate cycle is unique in both duration and intensity, reflecting the complex interplay of economic, social, and political factors.
Typically, these cycles follow a pattern of boom, bust, and recovery:
- Duration: Real estate cycles can vary greatly in length. Some may last only a few years, while others can extend over decades. The duration often depends on underlying economic conditions, such as employment rates, interest rates, and GDP growth, as well as broader societal trends like urbanization and demographic shifts.
- Intensity: The intensity of a real estate cycle refers to the magnitude of price fluctuations and transaction volumes during the boom and bust phases. An intense boom period is characterized by rapidly increasing property values and high transaction volumes, often driven by speculative investing and easy credit. Conversely, a severe bust might see steep declines in property values and a significant drop in market activity, influenced by tighter credit conditions, economic downturns, or regulatory changes.
The differences in duration and intensity can result in significantly different outcomes from one cycle to the next. For example, a cycle influenced by a robust economic backdrop and innovative financial products might exhibit a prolonged and intense boom followed by a sharp but brief correction. In contrast, cycles dominated by cautious lending and slow economic growth may feature more moderated growth and a less severe downturn. Understanding these dynamics is crucial for investors, policymakers, and stakeholders to navigate the real estate market effectively.
See you at a meeting Soon!
We meet twice a month.
Click here for information about the monthly luncheon.
Click here for information about our nighttime general meeting.
One of the premier sources for real estate investing networking and education is the SWFL REIA. In the real estate world, the SWFL REIA is different in that they do not do information product sales. Our meetings focus on the best ways of investing in real estate by collaborating with other property investors who are sharing their experiences.
We look forward to meeting you at a meeting soon!
Click here for membership information
Get our meeting notices and market data emailed to you.